

EPISODE 1 | FORENSIC EDITION | 17 NOVEMBER 2026 | PRE-PUBLICATION RESEARCH DRAFT
The evidence-based thesis: Nvidia is more than a seller of GPUs. It has disclosed major investments, customer-support commitments and cloud-purchase arrangements. These can accelerate infrastructure purchasing. The unanswered question is how much hardware demand would survive without supplier support. That is a testable economic question, not a finding of fabricated revenue.
1 | The departure is real. The alleged motive is not established.
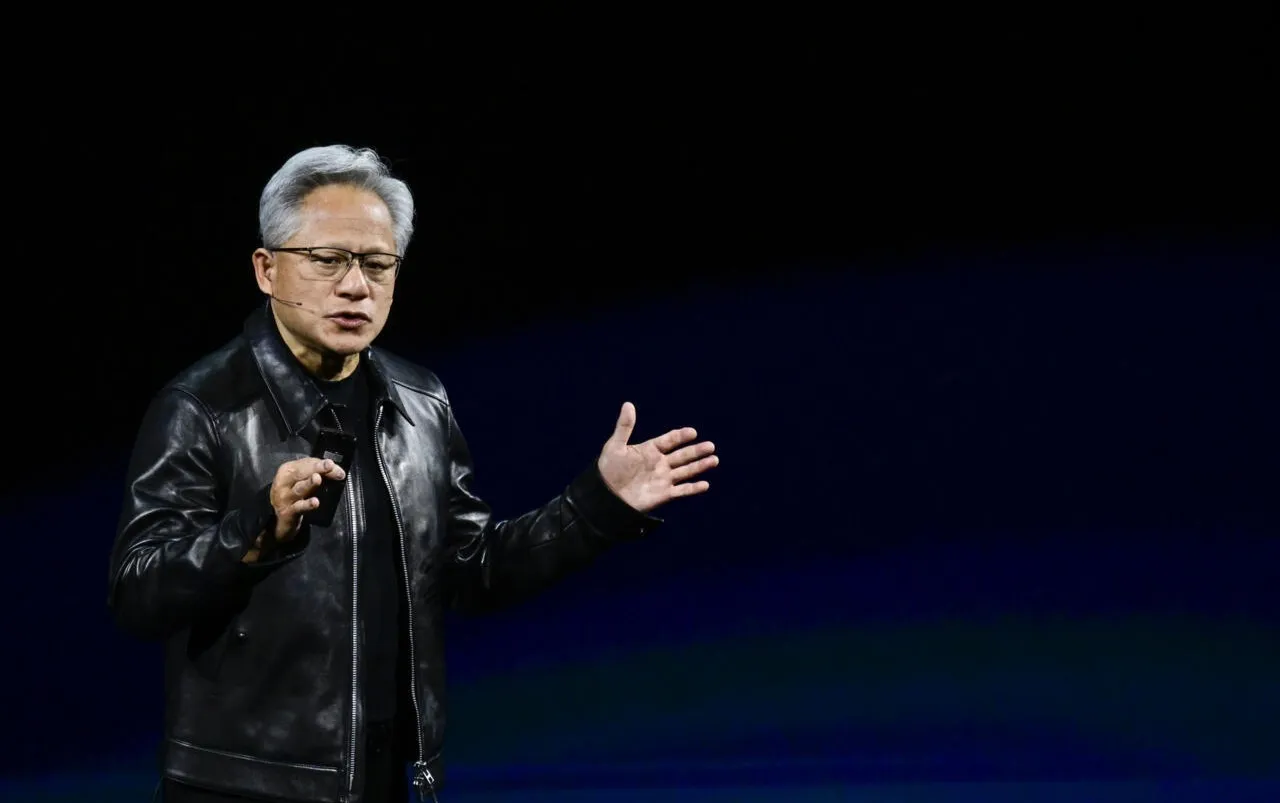
An Nvidia Form 8-K dated November 11, 2026 confirms that its board accepted Jensen Huang’s resignation as CEO, president and director, effective immediately, and appointed CFO Colette Kress interim CEO. The filing does not state that he departed to avoid financial losses, export-control liability or accounting exposure. Reporting about alleged personal relationships and suspected intelligence connections must be separately attributed and independently checked before publication. [1]
The more consequential financial story begins in the filings, not in conjecture about why Huang left. Nvidia has acknowledged that some AI-cloud partners buy its infrastructure while Nvidia undertakes cloud-service purchasing obligations. The supplier is also supporting demand for the infrastructure it supplies. [2]
2 | The financial fingerprint: receivables grew faster than sales
| Nvidia metric | FY27 Q1 / earlier | FY27 Q2 / later | Interpretation |
| Quarterly revenue | $81.62bn | $96.22bn | +17.9% QoQ |
| Net accounts receivable | $40.71bn | $63.06bn | +54.9% QoQ |
| Quarter-end DSO proxy | 44.9 days | 59.0 days | +14.1 days |
| FY27 H1 revenue | — | $177.84bn | +95.8% YoY vs $90.81bn |
| FY27 H1 net income | — | $118.01bn | Income, not cash |
Calculations: 63.059 / 96.221 x 90 = 59.0 days; 40.71 / 81.616 x 90 = 44.9 days. DSO is a rough quarter-end proxy, not invoice ageing. A/R grew about $22.35bn QoQ, compared with about $14.61bn incremental quarterly revenue. Strong growth, shipment timing and credit terms can all explain part of this divergence. [2]
Important counterevidence: Nvidia also reported substantial operating cash generation. Its cash-flow statement showed operating cash flow of approximately $24.08bn in FY27 Q2 and $74.42bn for the first half. A large receivable balance is not equivalent to fictitious sales or a failure to collect. The issue is the marginal quality and timing of collections. [2]
3 | The commitments: numbers too large to ignore, but not additive
THE JENSEN FILES | FORENSIC RESEARCH EDITION 1
| Disclosed category (July 2026) | Amount | What it does / does not mean |
| Equity investments | $99bn | Investment asset exposure; includes market values, not equivalent to customer cash subsidies |
| Equity investment commitments | $25bn | Potential future investment subject to terms |
| AI cloud purchase commitments | $36bn | Future service-purchase exposure, not GPU revenue |
| Third-party lease commitments | $20bn | Future lease exposure, different economic and accounting category |
| AI cloud lease guarantees | $3.5bn | Contingent credit support; not necessarily funded |
These figures represent different accounting and contractual categories and may overlap economically. Adding them to claim $183.5bn of artificial sales would be incorrect. The relevant investigation matches each specific commitment to the related customer, order, financing facility and cash-flow period. [2]
4 | CoreWeave: the stress test of the neocloud model
| CoreWeave, Q3 / Sept 2026 | Reported / approximate |
| Quarterly revenue | $3.66bn |
| Quarterly net loss | ($0.71bn) |
| Quarterly net interest expense | $0.85bn |
| Accounts receivable | $4.28bn |
| Approx. A/R / sales x 90 | 105 days |
| Nine-month operating cash flow | $5.64bn |
| Nine-month cash capital expenditure | $23.56bn |
| Nine-month financing cash inflow | $21.35bn |
| Debt principal outstanding | $47.51bn |
| Cash balance | $4.12bn |
The figures suggest a business with strong contracted demand but exceptionally high capital intensity. Approximate nine-month operating cash flow less cash capex was negative $17.92bn, before other investing flows. Debt principal / latest-quarter annualized revenue is roughly 3.25x; this is a rough scale comparison, not a covenant leverage ratio. [3]
CoreWeave’s operating cash flow was supported by customer prepayments and increases in deferred revenue. That is real cash, but it may fund infrastructure before the associated service revenue is earned. It must be distinguished from recurring cash generated after operating costs, debt service and maintenance capex. [3]
5 | The supplier as backstop
THE JENSEN FILES | FORENSIC RESEARCH EDITION 2
Nvidia’s September 2025 agreement to buy up to $6.3bn of residual CoreWeave capacity, subject to contractual conditions, is a particularly revealing mechanism. A lender can underwrite GPU infrastructure differently if a major technology supplier has committed to buy some unsold capacity. This may unlock equipment orders that otherwise would be delayed. The agreement does not establish that the entire $6.3bn was paid or that the corresponding hardware revenue was improper. [4]
The proper counterfactual is: would CoreWeave have bought the same GPUs, at the same time and price, without Nvidia’s guarantee, investments and commercial support? Public filings do not provide the customer-level order-by-order answer.
6 | An additional layer: Core Scientific and the counterparty chain
Core Scientific’s September 2026 filing states that CoreWeave accounted for approximately 84% of its total revenue in the first nine months of 2026, and 100% of its colocation revenue. Core Scientific reported $1.5bn in nine-month capex, including $180.9m funded by CoreWeave, and approximately $4.4bn of future construction and purchase commitments. This demonstrates that the chain extends beyond Nvidia and CoreWeave to power and colocation providers whose economics depend on neocloud obligations. [5]
This is not evidence of fraud. It is evidence of concentrated counterparty exposure spreading through multiple balance sheets. The downstream customer ultimately paying for computing remains the decisive economic variable.
7 | A falsifiable revenue-acceleration model
Illustrative only: assume a supplier reports $100bn in quarterly revenue and 10% of orders are advanced by one year because of financing support. That would mean $10bn of timing-sensitive orders, not $10bn of false revenue. If independent end-user demand subsequently catches up, acceleration is sustainable. If it does not, later orders may fall and the supplier may face further financing pressure. Neither the 10% assumption nor a company-specific causal amount has been established for Nvidia.
| What to test | Evidence needed | What would weaken the thesis |
| Customer independence | Ultimate end-user revenue, utilization, rental rates | High utilization and independent prepayments |
| Financing dependence | Credit facilities, equity funding, Nvidia guarantees | Purchases funded without Nvidia support |
| Cash conversion | Invoice cohorts, payment dates, aging | Timely collections and declining DSO |
| Revenue timing | Order dates, delivery, transfer of control | No material pull-forward from support |
| Downstream resilience | Cloud cash margins, refinancing schedule | Positive returns after capex and debt costs |
8 | Why the export-control investigation is a separate story
The alleged diversion of Nvidia-powered servers through intermediaries to China raises serious questions about ultimate end users, export licensing and compliance. But an export-control allegation against a distributor or server-maker executive is not proof that Nvidia recognized fictitious revenue, and it is not proof that Nvidia leadership knowingly participated. Shipment values, Nvidia sales, cash receipts and criminal liability must each be traced separately. Any named allegation requires verification against the
THE JENSEN FILES | FORENSIC RESEARCH EDITION 3
operative charging document and the accused party’s response.
9 | The central conclusion
The numerical record supports three propositions. First, Nvidia has deliberately invested in and supported the AI infrastructure ecosystem. Second, some counterparties are highly leveraged, capital intensive and reliant on long-term contracts and external financing. Third, Nvidia’s receivables expanded sharply in its July 2026 quarter, while it continued to generate substantial cash. Together these facts justify a rigorous revenue-quality investigation. They do not establish fabricated sales, a coordinated accounting conspiracy, or a deliberate exit by Huang to escape a collapse.
The question for Nvidia’s next earnings call: How much revenue, by quarter since 2023, came from customers benefiting from Nvidia equity, guarantees, cloud-purchase agreements or other support? What proportion was collected in cash, and how much deployed capacity is supported by unaffiliated end-user demand?
Primary-source notes and verification trail
[1] Nvidia 8-K, Nov 11 2026: https://www.sec.gov/Archives/edgar/data/1045810/000104581026000082/nvda-20261111.htm [2] Nvidia FY27 Q2 10-Q, July 26 2026: https://www.sec.gov/Archives/edgar/data/1045810/000104581026000075/nvda-20260726.htm [3] CoreWeave 10-Q, Sept 30 2026: https://www.sec.gov/Archives/edgar/data/1769628/000176962826000465/crwv-20260930.htm
[4] CoreWeave September 2025 residual-capacity agreement: consult its SEC 8-K and subsequent 10-Q contract disclosures; confirm exact contract terms before publication.
[5] Core Scientific 10-Q, Sept 30 2026: https://www.sec.gov/Archives/edgar/data/1839341/000183934126000030/core-20260930.htm
EDITORIAL STATUS: Quantitative research draft, not publication-cleared. Figures derived from cited filings and calculations; no original interviews, invoice-level verification, company right-of-reply, or external legal review have yet been completed. Historical comparison figures and contractual interpretations require final independent fact check.
